Covariance

Covariance is a measure of how much two random variables vary together. It's similar to variance, but where variance tells you how a single variable varies, covariance tells you how two variables vary together.
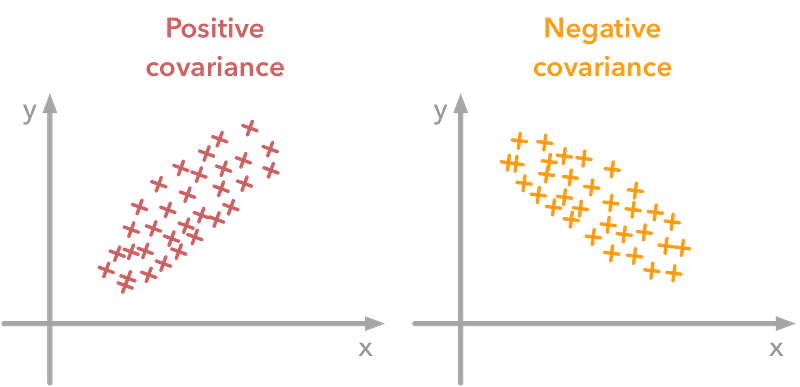
A positive covariance means that the two variables at hand are postively related, and they move in the same direction.
A negative covariance means that the two variables are inversely related, or that they move in opposite directions.


The formula to calculate covariance is as follows, $$ cov_{x, y} = \frac{ \sum (x_i - \bar{x})(y_i - \bar{y})}{N - 1} $$

In [1]:
import numpy as np

def covariance(x, y):
    '''
    Returns covariance between two array-like objects of numeric values.
    
    Parameters: 
    
    x: array-like object of numeric values
    y: array-like object of numeric values
    '''
    if len(x) != len(y):
        return 
    
    x_mean = np.mean(x)
    y_mean = np.mean(y)
    sum = 0
    
    for i in range(len(x)):
        sum += ((x[i] - x_mean) * (y[i] - y_mean))
    
    return sum / (len(x) - 1)
In [2]:
# Generating x and y:
x = np.arange(10)
y = x + np.random.rand(10)    # Adding some noise using rand()
print(f"x: {x}")
print(f"y: {y}")
x: [0 1 2 3 4 5 6 7 8 9]
y: [0.75748157 1.33266435 2.5820461  3.13766692 4.6475828  5.05373785
 6.43012799 7.23605775 8.26982824 9.96623949]
In [3]:
# Let's plot the data 
import matplotlib.pyplot as plt
import seaborn as sns
%matplotlib inline

sns.scatterplot(x = x, y = y, palette = "Pastel1")
plt.xlabel("x")
plt.ylabel("y")

plt.show()
/tmp/ipykernel_4004/716813267.py:6: UserWarning: Ignoring `palette` because no `hue` variable has been assigned.
  sns.scatterplot(x = x, y = y, palette = "Pastel1")

It's obvious that covariance between x and y must be positive.

In [4]:
print(f"Covariance: {covariance(x, y)}")
Covariance: 9.166253608051877
In [5]:
# Using cov function of numpy to calculate the covariance 
print(f"Covariance: {np.cov(x, y)[0][1]}")
Covariance: 9.166253608051877

np.cov() always returns the covariance matrix.


Correlation

Correlation is also a measure of how much two random variables change together. However,

  • Covariance only indicates the direction of the linear relationship between variables, whereas correlation measures both strength and direction of the linear relationship between two variables.
  • Covariance values are not standardized, whereas correlation values are standardized.

The Pearson product-moment correlation coefficient, also known as $r, \rho$, or Pearson's $r$, is a measure of the strength and direction of the linear relationship between two variables that is defined as the covariance of the variables divided by the product of their standard deviations.


The correlation is unitless and always lies between -1 (perfect anti-correlation) and 1 (perfect correlation).
The formula of Pearson's r is as follows, $$ \rho \ (or \ r) = \frac{cov_{x, y}}{\sigma_x \sigma_y} = \frac{ \sum (x_i - \bar{x})(y_i - \bar{y})}{ \sqrt{\sum (x_i - \bar{x})^2 \sum(y_i - \bar{y})^2}} $$

In [6]:
def correlation(x, y):
    '''
    Returns correlation between two array-like objects of numeric values.
    
    Parameters: 
    
    x: array-like object of numeric values
    y: array-like object of numeric values
    '''
    return np.corrcoef(x, y)[0][1]    # np.corrcoef() always returns the correlation matrix
In [7]:
# Using the same data x and y as above
print(f"Correlation: {correlation(x, y)}")
Correlation: 0.995402722824334